Microsoft Application Insights - APM for Everyone
- Published on
- Reading time
- Authors
- Name
- Simon Waight
- Mastodon
- @simonwaight


When you work as heavily as I have with a technology like Application Insights you do tend to forget the amazing power you have at your fingertips.
Over the last few years I've come to rely heavily on Application Insights as the primary Application Performance Management (APM) tool of choice for services I build, whether they are hosted in Azure or not.
In this post I am going to take a quick walk through features that I think every developer should now about with Application Insights so they can also get maximum benefit from it too!
Your language has an SDK
Chances are pretty good that if you're on a popular platform that Application Insights will have an SDK you can use. SDKs are great because adding them to a solution produces a bunch of default telemetry with nothing more than a Telemetry Key required.
The Application Insights team maintains their SDK documentation and SDK code references on Github. Needless to say .NET has great support, but Java, JavaScript and Node.js also get first-party support, with community support for Go, Python and Ruby. Want to do APM that includes native mobile experiences? No problem, drop in the HockeyApp SDKs.
Use it regardless of your hosting environment
Not using Azure to host your solution? Not a problem. If you can make outbound calls from your host to Application Insights then you can use Application Insights. 💯
Useful free tier
In an upcoming post I'll talk more about perceived and actual value of free services in the cloud, but let me say for most basic scenarios the 5 GB of ingested Application Insights data per month will more than suffice. If not, you can manage your costs by moving to a sampling model that means you can still glean useful insights about your application's behaviours without breaking the bank.
No features are removed at the free tier pricing tier either - you can still do full analytics on the log information that is captured!
Dependency tracking
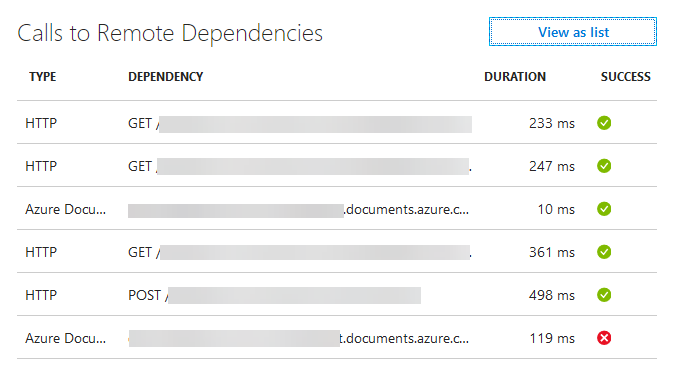
The out-of-the-box dependency tracking is super handy to diagnose performance issues that result from upstream calls.
The only downside here is that the default capabilities are good at tracking HTTP-based dependencies, SQL Server, and not much else (at time of writing). Having said this, there is a published way for you to track other custom dependencies if needed, though it requires dedicated code - the out-of-the-box tracking requires no additional special code which is amazing!
I have to say that HTTP dependency tracking has been exceptionally useful in a REST-heavy environment, even tracking HTTP calls to external service providers like SendGrid, Twilio and others, providing us an easily accessible view on where our latency is arising from.
The sample below shows dependency behaviour for a single request to a caching service in an application. The very first request (at bottom of list) is a call to Cosmos DB which returns a 404 (Not Found) HTTP status code which then triggers a lookup of some data via a HTTP call to an API with the result returned then written to Cosmos DB for the next request. This is super useful information and I did precisely nothing to my code (other than add the Application Insights SDK to my solution) to capture this for every request!

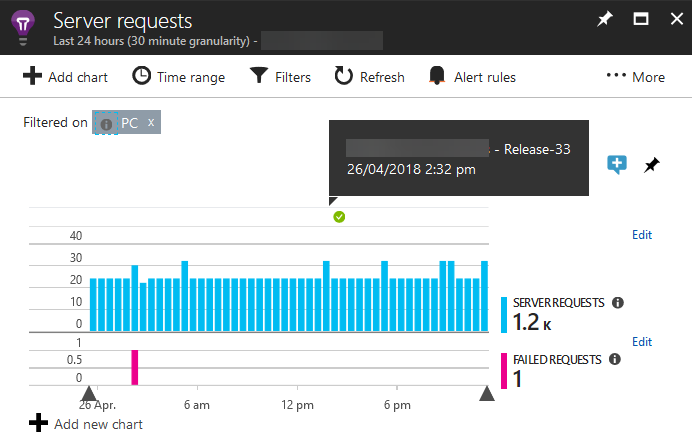
Track impact of releases
Application Insights has a REST API which allows you to add custom steps to Continuous Deployment pipelines to publish a Release Annotation to your timeline in Application Insights so you can see if a release impacts your solution.
Visual Studio Team Services' Release Management will do this for you automatically, but if you aren't using VSTS then you can still leverage this capability. A sample is shown below (thankfully we had no negative impact with this release!)

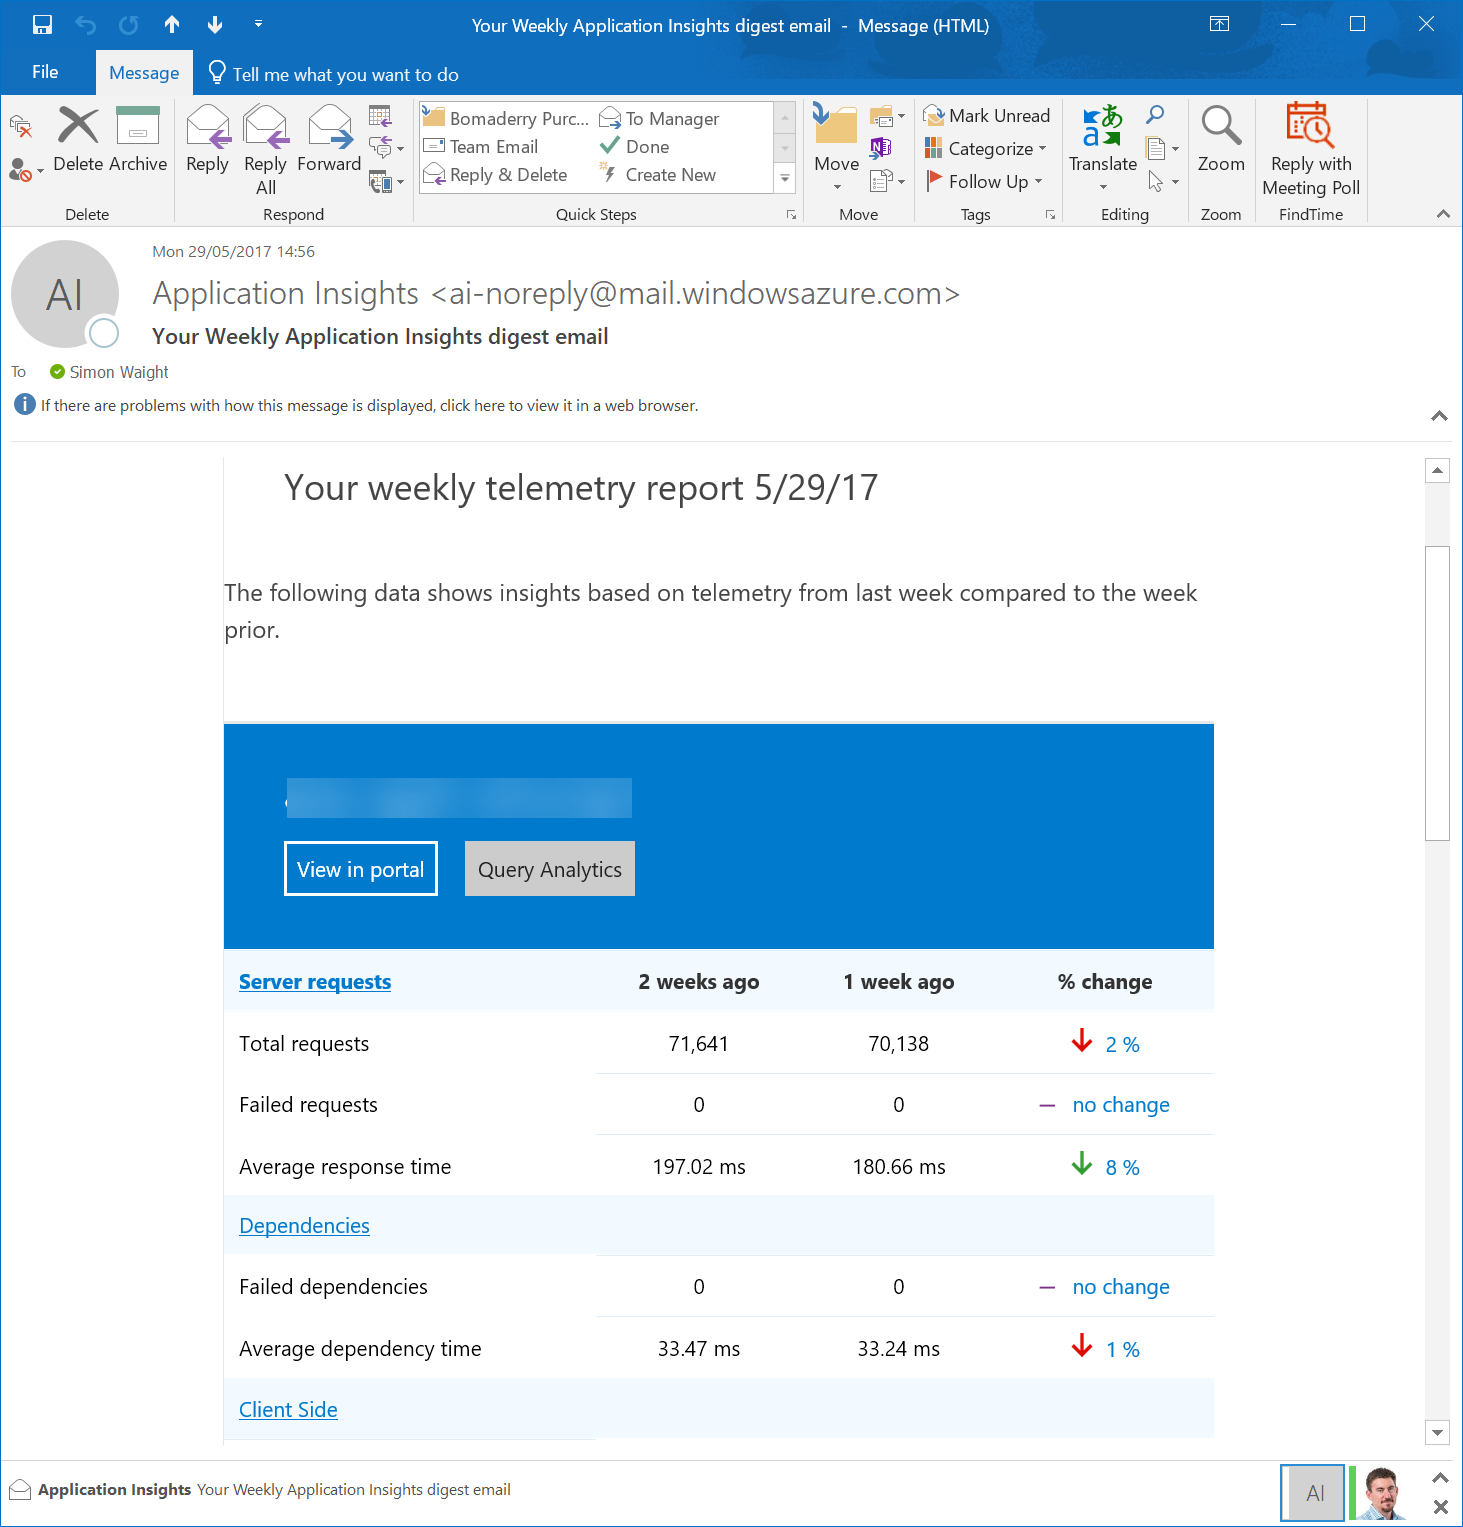
Insights to your inbox
Super handy if you don't want to go hunting for stats or you want to share aggregated stats with stakeholders.

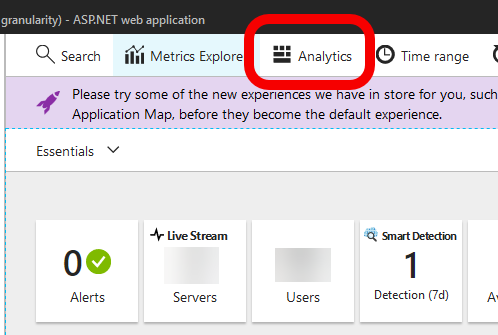
Heavy duty analytics
If the default experiences in the Azure Portal aren't enough, then you can leverage the power of Azure Log Analytics to perform more detailed queries and drill into your data and build tables or graphs from the results.
A good example of this is the answer I provided to the following on Twitter from Troy.
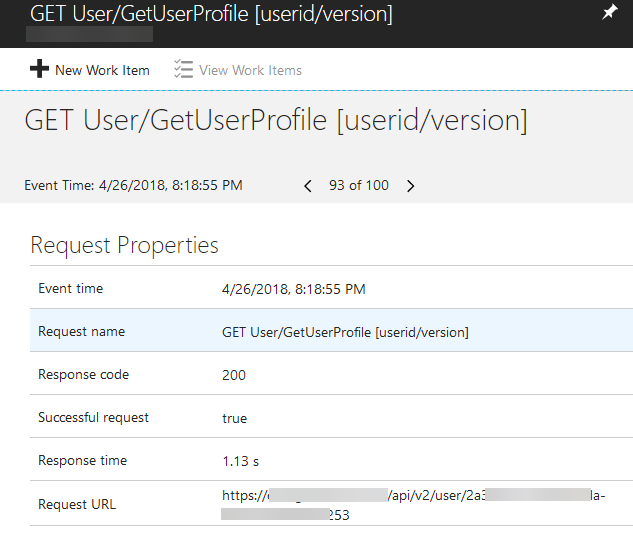
Each request will be captured along with useful metadata (in this case from the underlying .Net codebase) which allows us to do further querying and filtering on the data.
Here's a sample of such a request (this one is a HTTP request to an API endpoint) with the metadata shown which is needed to help solve Troy's question.

The trick is then to head over to the Log Analytics environment...

.. and then drill into the data to provide you with your desired answer.

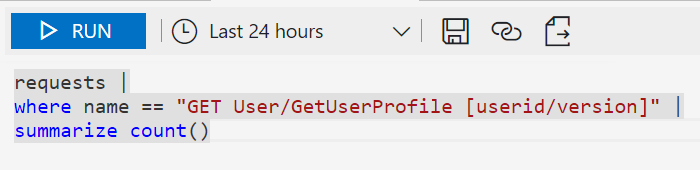
You can then tabulate or graph the output. The above is a really simple query - trust me, you can do far more complicated than this!
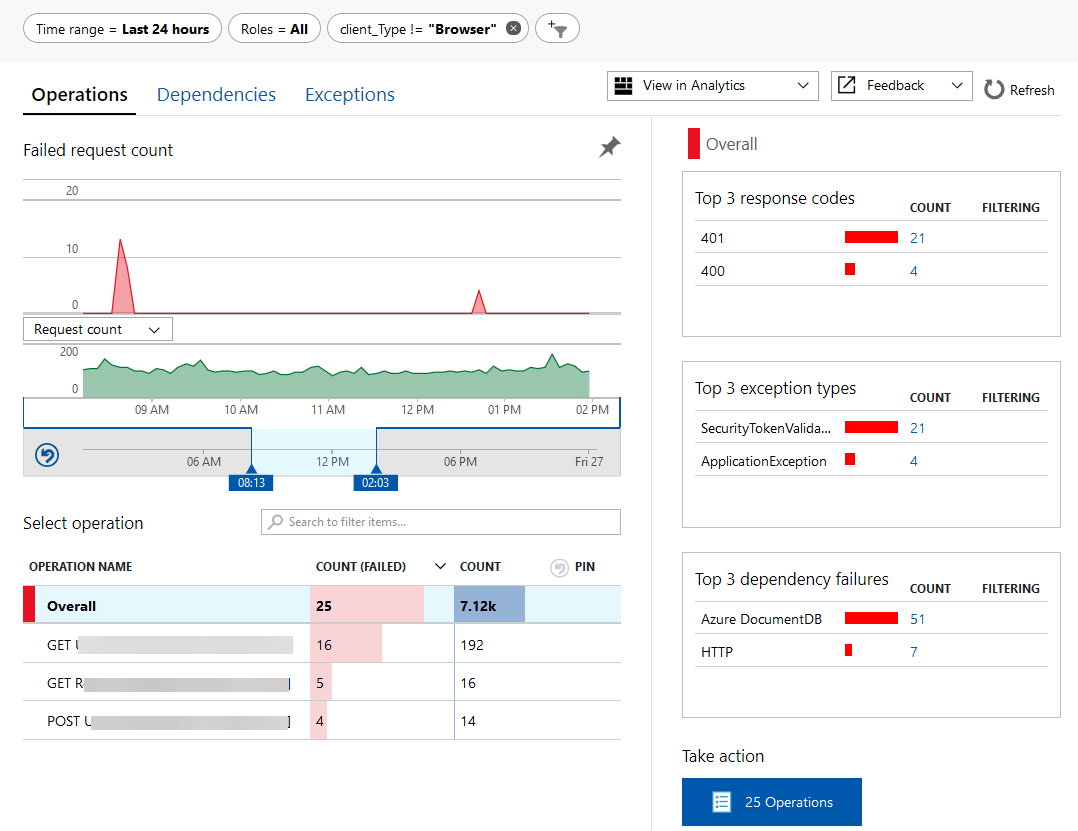
Failure drill-in
This view has recently improved and become far more interactive - you can easily identify common reasons for failures and drill right in to, in my experience, identify root cause within a matter of moments!
In HTTP applications you do get a bit of expected noise (things like expected 401, 403 and 404 errors) which can be annoying to sift through, particuarly for REST-type APIs, but it's a small price to pay for the power you get!

Availability Checks, Health Alerts and Smart Detection
I'm not going into these in too much detail, but you can also set Alerts and health checks in Application Insights and the service will also do analysis of trends and alert you to items that may require your attention (even if you don't have a specific rule set).
Custom Events, User Journeys and Cohorts
Like health checks I am not going to go through these in detail, but if this is the sort of insight you need, then it is possible to access it here too. If you need to log custom data in Application Insights you can do that too using Custom Events.
What are you waiting for?!
I can honestly say I would be hard pressed these days to build anything without including Application Insights in it, particularly if I won't have direct access to the hosting environment.
Troubleshooting runtime issues becomes much easier with the details you can glean from walking request stacks as presented by Application Insights. I've isolated and fixed more than my fair share of runtime issues (mostly configuration related) without ever needing to try and reproduce locally because I could quickly tell via the telemetry where things were going wrong.
Happy days! 😎