Real-time air quality monitoring and alerting – Part 2 - Training Azure Anomaly Detector
- Published on
- Reading time
- Authors

- Name
- Simon Waight
- Mastodon
- @simonwaight
In the first part of this series, I looked at how you can use a sensor from PurpleAir to capture data on the quality of the air at a location and then route that information to a custom IoT endpoint in Microsoft Azure.
The captured data on its own is not that useful, and really what I want to do is detect when it might not be safe to go outside due to sudden changes in air quality. Now, I could write a bunch of logic to detect when readings go outside of given parameters, but what I really want is a generic way to detect anomalous data points which likely indicate a rapid change in conditions, so trying to achieve that simply via coded logic could be tricky.
Thankfully Azure Cognitive Services has a pre-built model that is targeted at anomaly detection, so in this post I am going to look at how we can train this service for our specific use case.
What are we tracking?
We are capturing a range of data as part of our custom IoT solution, and I'd like to detect changes in a few data points, so I am going to use multivariate anomaly detection which allows us to check for changes in multiple data points at the same time. The four items I want to track are:
- Particles PM10
- Particles PM25
- Temperature
- Humidity
Preparing our training data
While Anomaly Detector is a great general-purpose service, we need to train the model for our particular use case. Thankfully we can use data we have already captured for this purpose.
Our first step is to prepare our training data. There are a few requirements I need to be aware of when preparing this data:
- For multi-variate training I need data for each data point in its own file - so for me that would be four files (temperature, humidity and my two particle readings). The number of variables (files) used in training must match what we will use for inferencing
- The format of the input data series must be CSV and contain precisely two fields per line - "timestamp" and "value"
- Any small timing variations in our timestamp must be removed. Looking at my raw data I can see most values are captured with a 2-minute gap at 30 seconds past the minute. Periodically though, I see a value captured at 31 seconds past the minute which I will need to fix.
Using Azure Stream Analytics
Each Azure IoT Hub comes with an in-built Azure Event Hub endpoint free-of-charge. The Event Hub endpoint provides a quick way to integrate with other Azure services such as Azure Stream Analytics, which is what we are going to use transform our raw IoT data into the necessary format for training our anomaly detector.
Azure Stream Analytics provides a straight-forward way to process data streams through use of a SQL-like query language and transparent input and output formatting where you don't need to write any custom logic to read from a stream and write to a range of different output types.
We will manage our three training data requirements (see above) as follows:
- You can have multiple queries and outputs in a single Azure Stream Analytics job, so I can query, transform and save the same incoming data multiple times to different locations
- I can define the output format for my job to produce the necessary CSV file format with two fields
- Using the in-built Date and Time Functions I can smooth out my datapoints to meet the requirement for values to be at consistent time differences. I am not worried about a loss of accuracy in my scenario, though in some use cases you'd likely want to address at the data producer.
Finally, I also need to determine which of the two particle sensor readings to use. PurpleAir does some additional work in their solution to check the readings to avoid problems arising from a failed sensor or otherwise inaccurate read, but for my use case I'm happy to simply go with the reading that is the highest. To achieve this, I use the CASE statement in my Stream Analytics query, which you can see in full below.
SELECT
    DATETIMEFROMPARTS (DATEPART(year,readtime), DATEPART(month,readtime), DATEPART(day,readtime), DATEPART(hour, readtime), DATEPART(minute, readtime), 30, 0) as 'timestamp',
    temperature as value
INTO
    [temperaturedatacsv]
FROM
    [rawiotjsondata]

SELECT
    DATETIMEFROMPARTS (DATEPART(year,readtime), DATEPART(month,readtime), DATEPART(day,readtime), DATEPART(hour, readtime), DATEPART(minute, readtime), 30, 0) as 'timestamp',
    humidity as value
INTO
    [humiditydatacsv]
FROM
    [rawiotjsondata]

/* Parse values from both sensors and select the higher one. Does not allow for failure of one sensor, but works for our use case. */
SELECT
    DATETIMEFROMPARTS (DATEPART(year,readtime), DATEPART(month,readtime), DATEPART(day,readtime), DATEPART(hour, readtime), DATEPART(minute, readtime), 30, 0) as 'timestamp',
    CASE
      WHEN pm100atma < pm100atmb THEN pm100atmb
      ELSE pm100atma
    END as value
INTO
    [pm10datacsv]
FROM
    [rawiotjsondata]

/* Parse values from both sensors and select the higher one. Does not allow for failure of one sensor, but works for our use case. */
SELECT
    DATETIMEFROMPARTS (DATEPART(year,readtime), DATEPART(month,readtime), DATEPART(day,readtime), DATEPART(hour, readtime), DATEPART(minute, readtime), 30, 0) as 'timestamp',
    CASE
      WHEN pm25atma < pm25atmb THEN pm25atmb
      ELSE pm25atma
    END as value
INTO
    [pm25datacsv]
FROM
    [rawiotjsondata]
You can find the full Stream Analytics solution, including some sample data, on GitHub.
The minimum number of readings recommended for training Anomaly Detector is 15,000. Given we are sampling every 2 minutes it would take us a while to hit 15,000 readings (almost 3 weeks), so to get things rolling I will capture a few days of data and train with that.
It's important to note that there is no free tier for Stream Analytics, so along with a small amount of data being written to Azure Storage, I will incur some costs for this stage of my project. I'm OK with this as this is a temporary solution to capture my training data. As a way to reduce cost I have made sure to run only 1 streaming unit for the Stream Analytics job and have disabled autoscale. Based on public pricing for West US 2, for a Standard Job with a single scale unit, it should cost me about $3.70 (USD) to process 24 hours of data.
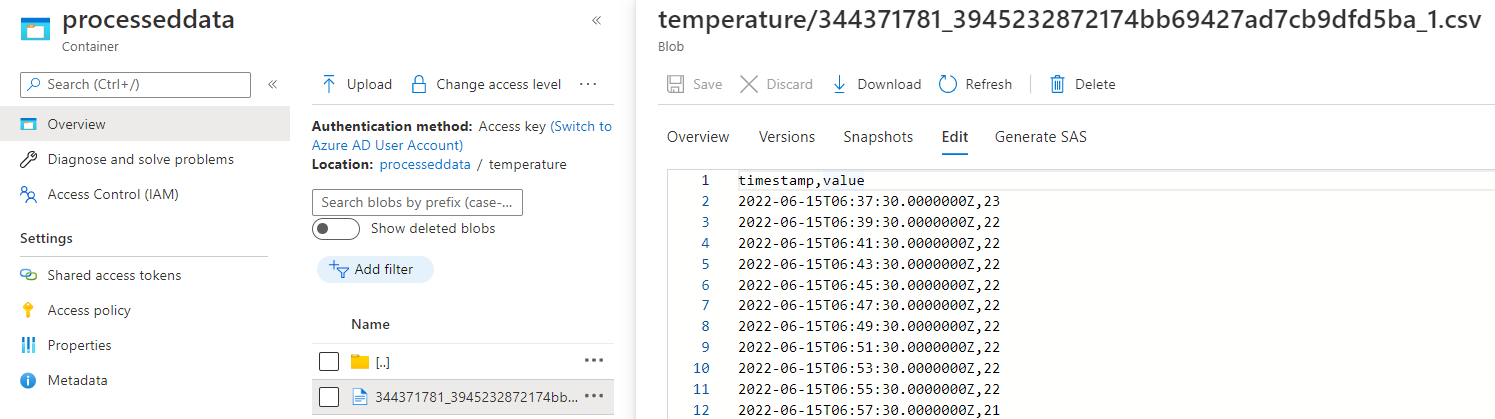
Once our Stream Analytics job has been running for a while we'll find a CSV file is created in the Storage Account we've configured and we are now building some great training data! The below screenshot shows the temperature data file. Once we hit file size or time limits on the file, Stream Analytics will simply create a new one and start streaming to that.
Pro tip: don't light your fire pit!
I thought I would take a quick side quest here to talk about what not to do when capturing training data!
The Anomaly Detector documentation discusses the required data quality for training your instance and notes that you need less than 1% abnormal values for accurate training.
What's the one thing you probably shouldn't do when capturing air quality training data? Do anything likely to cause a drop in air quality (or, in our case, an increase in particles), like having a fire put lit during winter.
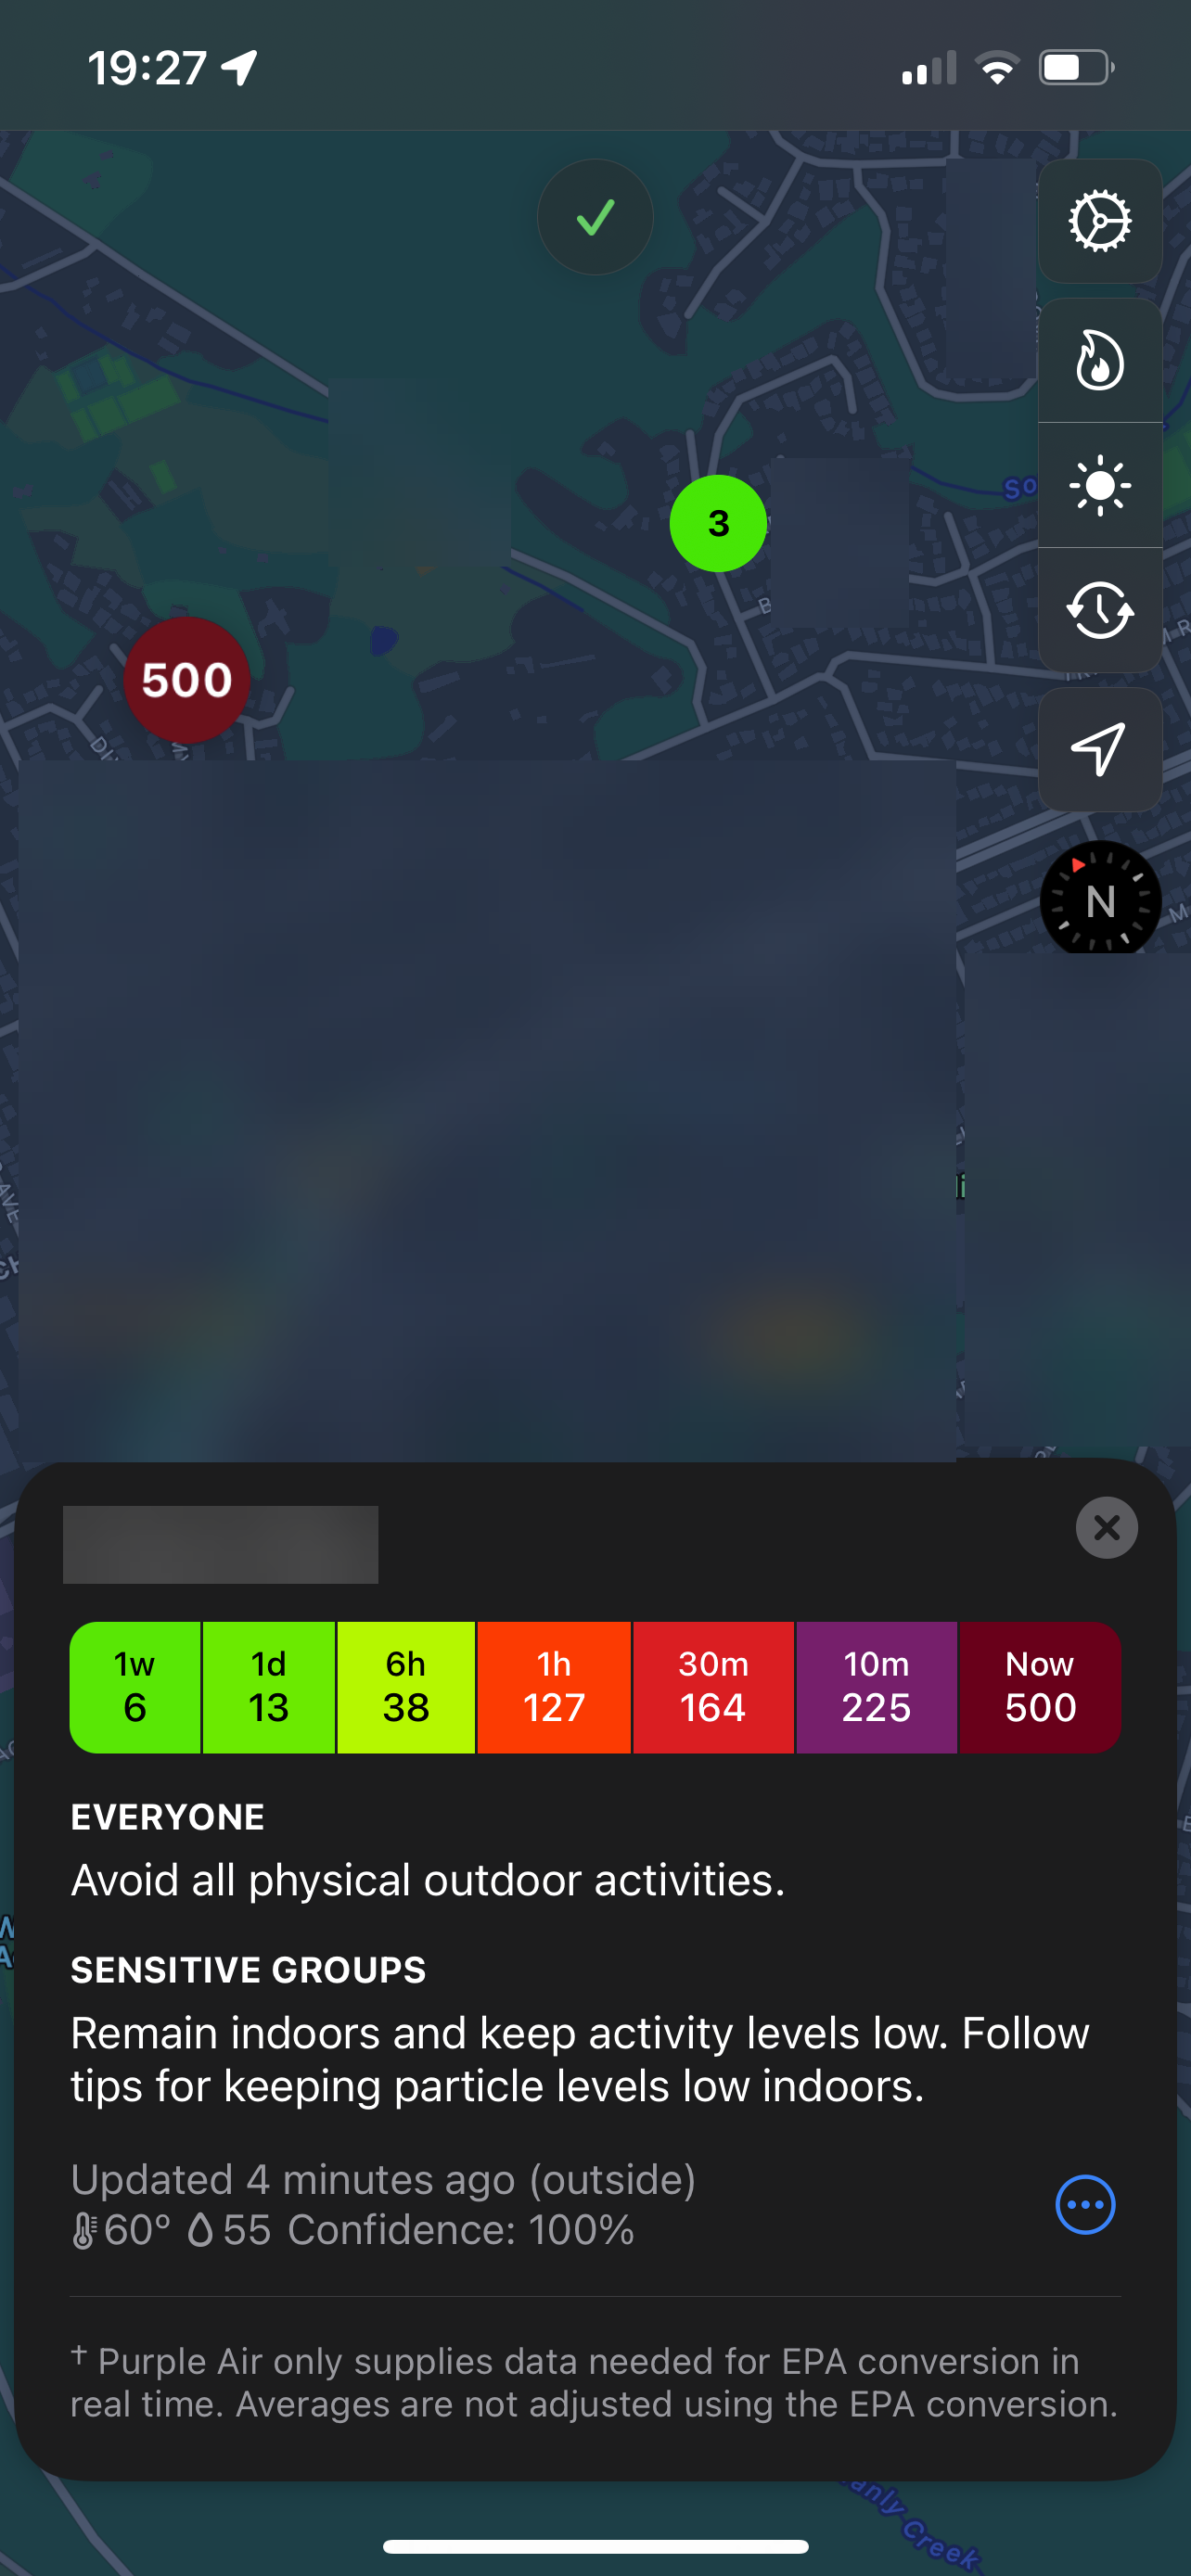
The below screen capture from the excellent Paku app shows how bad the quality was during the toasting of marshmallows! That 500 reading is my sensor, with the 3 value showing a reading from a nearby sensor.
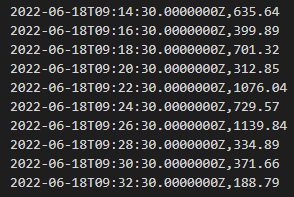
The captured training data shows the true horror (those right-side numbers are usually < 10, and typically around 0)...
Now, if the bad readings represent < 1% of all of my training data we could use 'as is', if not I would need to source more or better quality data. If we trained with this data our detector would be unlikely to work with any accuracy.
Now with our side quest complete, back to the main thread!
Training our model
Once we have enough data captured we can go ahead and train our Anomaly Detector instance. In order to do this we need to make sure we meet the requirement for the source data as per instructions.
Firstly, I am going to download the four (or more) CSV files and combine multiple files for the same variable (temperature, humidity, pm10, pm25) into single CSV files with the resulting filename matching the variable name (i.e. temperature.csv, humidity.csv, pm10.csv, pm25.csv). I will then take these four files and zip them up. The sample files in the GitHub repository show you what this looks like.
Once zipped up I will upload the file back into an Azure Storage Account. If you upload the file to a Private Storage Account, or have Blob visibility set to Private, make sure to generate a SAS key for the file so we can read the file later on.
The Anomaly Detector documentation provides a Python script you can use to train your model, but I'm going to use the Cognitive Service's API Console to simplify this process.
You can navigate to the API Console via the Anomaly Detector instance's Overview Tab in the Azure Portal. The API Console page for the multivariate training endpoint that is hosted in West US 2 can be found (at time of writing) at the URL https://westus2.dev.cognitive.microsoft.com/docs/services/AnomalyDetector-v1-1-preview/operations/TrainMultivariateModel.
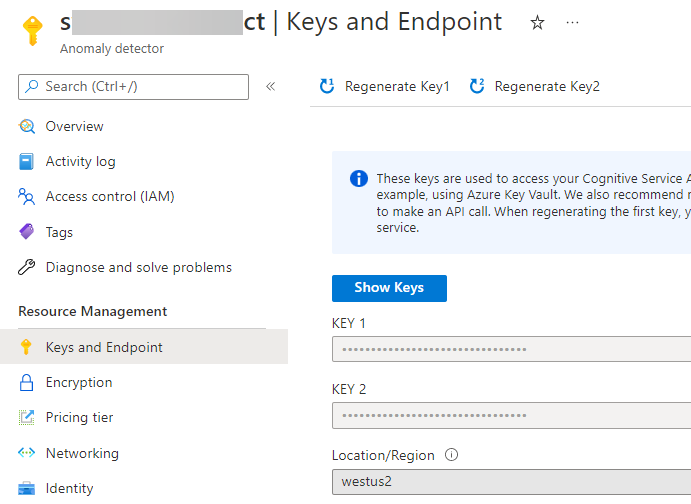
In order to use the API Console with your instance, you will need to grab the instance name of your Anomaly Detector, along with one of the API Keys. These values can be found via the Keys and Endpoints navigation option in the Azure Portal.
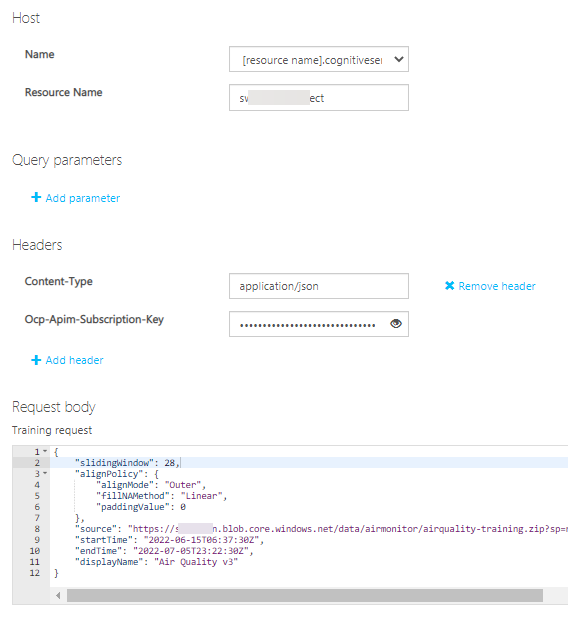
We now have the inputs we need to call the training endpoint via the API Console, so go ahead and click the "Open API test Console" button and complete the form as follows:
- Resource Name: put your Anomaly Detector name (i.e. simonstestad01)
- Ocp-Apim-Subscription-Key: put your Anomaly Detector Key
- Update the Request Body and replace:
- slidingWindow: set to between 28 and 2,880. Important value to set - see below!
- source: paste in the URL to your test zip file, including any SAS token
- startTime: update to match the first record timestamp in your training data
- endTime: update to match the last record timestamp in your training data
- displayName: put a friendly name here for your model instance.
I mentioned above that the slidingWindow value is important, so let me expand on it a bit. The value you provide determines how many events (data points) you must supply to the model when both training and inferencing. If you supply less than this value, you will receive an error back from the API. Once this value is set at training time it cannot be changed - you will need to train a new model instance if you want to change. For my purposes I will set the required data to the minimum. This would represent almost an hours' worth of readings which should be plenty.
Once you are happy with the settings, scroll to the bottom of the screen and click 'Send'. If you have posted a valid request, you should receive back a 201 HTTP response.
You can find out the status of your model by also using the API Console. If you navigate to the List Multivariate Models API definition and open the API test console you can use the Resource Name and API Key from the last invocation to see what the status of your model is. When training is completed the model's status should read READY, as shown in the below sample.
{
  "models": [{
    "modelId": "e88247b4-ed17-11ec-85a9-xxxxxxxxxxx",
    "createdTime": "2022-06-16T01:59:08Z",
    "lastUpdatedTime": "2022-06-16T02:00:34Z",
    "status": "READY",
    "displayName": "Air Quality",
    "variablesCount": 4
  }],
  "currentCount": 1,
  "maxCount": 300,
  "nextLink": ""
}
At this point we now have a trained anomaly detection instance we can call from any code and test to see if values supplied are anomalous or not. We'll look at how to do this in the next post in the series.
😎 Happy Days! 👉 Read Part 3 now!